2019. It was a very good year.
It was truly dynamic and rarest of years for global investors. Despite all the economic uncertainty surrounding the trade war and other macroeconomic factors, the returns across a wide spectrum of asset classes have been astounding. A complete U-turn from the bloodbath that we saw around Christmas of 2018 when everybody was expecting a global recession all certain to set in.
Performance Overview
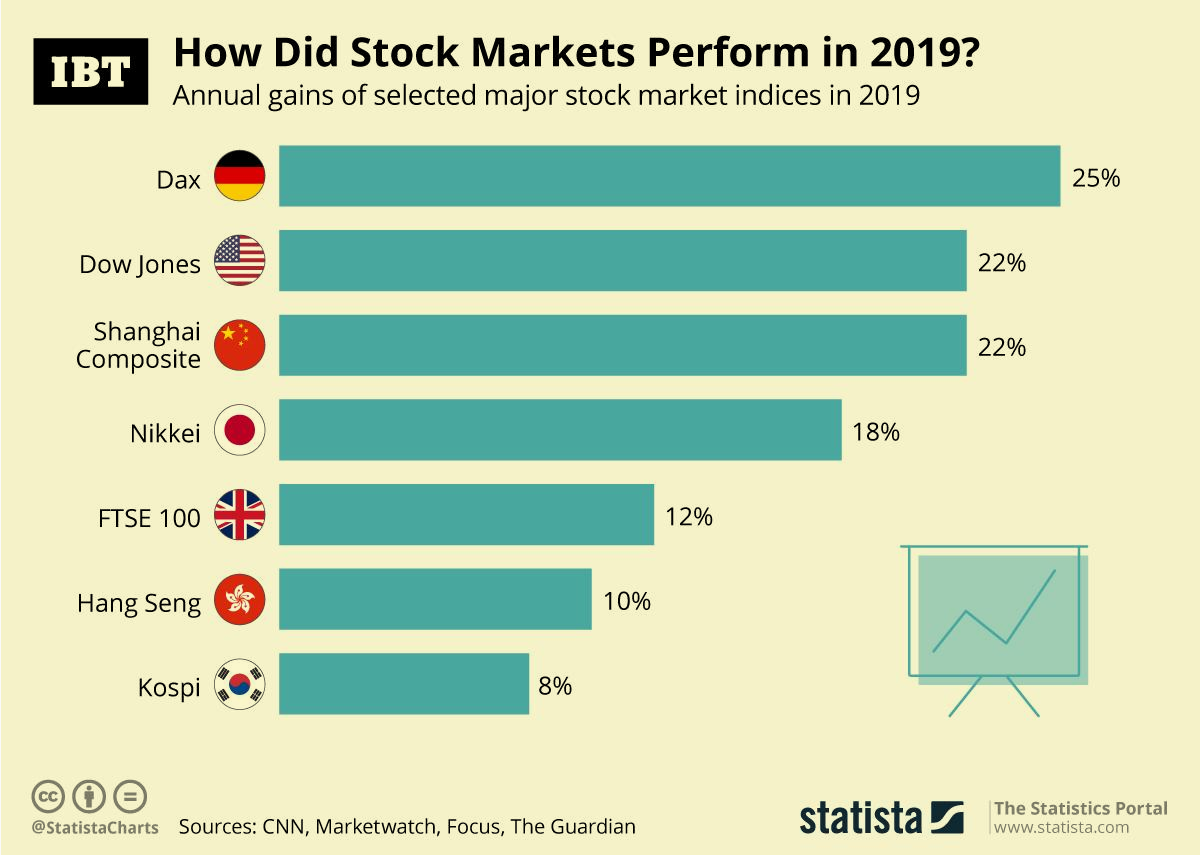
Yet it is a year later and we have ended 2019 with the bull market in the U.S entering its 11th year this last October. One of the biggest things that the year will be remembered for is the gains in all three major U.S indices — the benchmark S&P 500 posted 28.5% gains, which is the 6th biggest ever & the second-best since 1998. Dow Jones (DJIA) recorded 22% gains while the tech-heavy Nasdaq was up a massive 37%.
Apart from the superior performance of the broader market, the yield on the 10-year U.S. Treasury fell more than 0.75% with Gold & Oil both gaining roughly 10%. But this confluence of gains is a little unusual looking at the historical relationship between these different asset classes.
Changing Dynamics
Typically when stocks rise more than double digits as we have seen in the past year, 10-year Treasury yield does tend to fall but not by this bigger margin. Gold, which is traditionally being the hedge against risk and volatile times continued to rise despite a big rally in Equities, negating the inverse relationship between the two. This might be attributed to the trade war as a lot of investors opted for the safety of the precious metal.
And finally, Oil despite maintaining a long-term bearish trend still posted double-digit gains for the year. Despite being a concerning sign for the companies whose profit margins get cut due to increased costs, they continued to perform well. The increase in oil prices could, however, be attributed to OPEC’s consistent cuts to the supply. Also, the massive corporate tax cuts in the U.S supported firms’ robust revenue growth & performance.
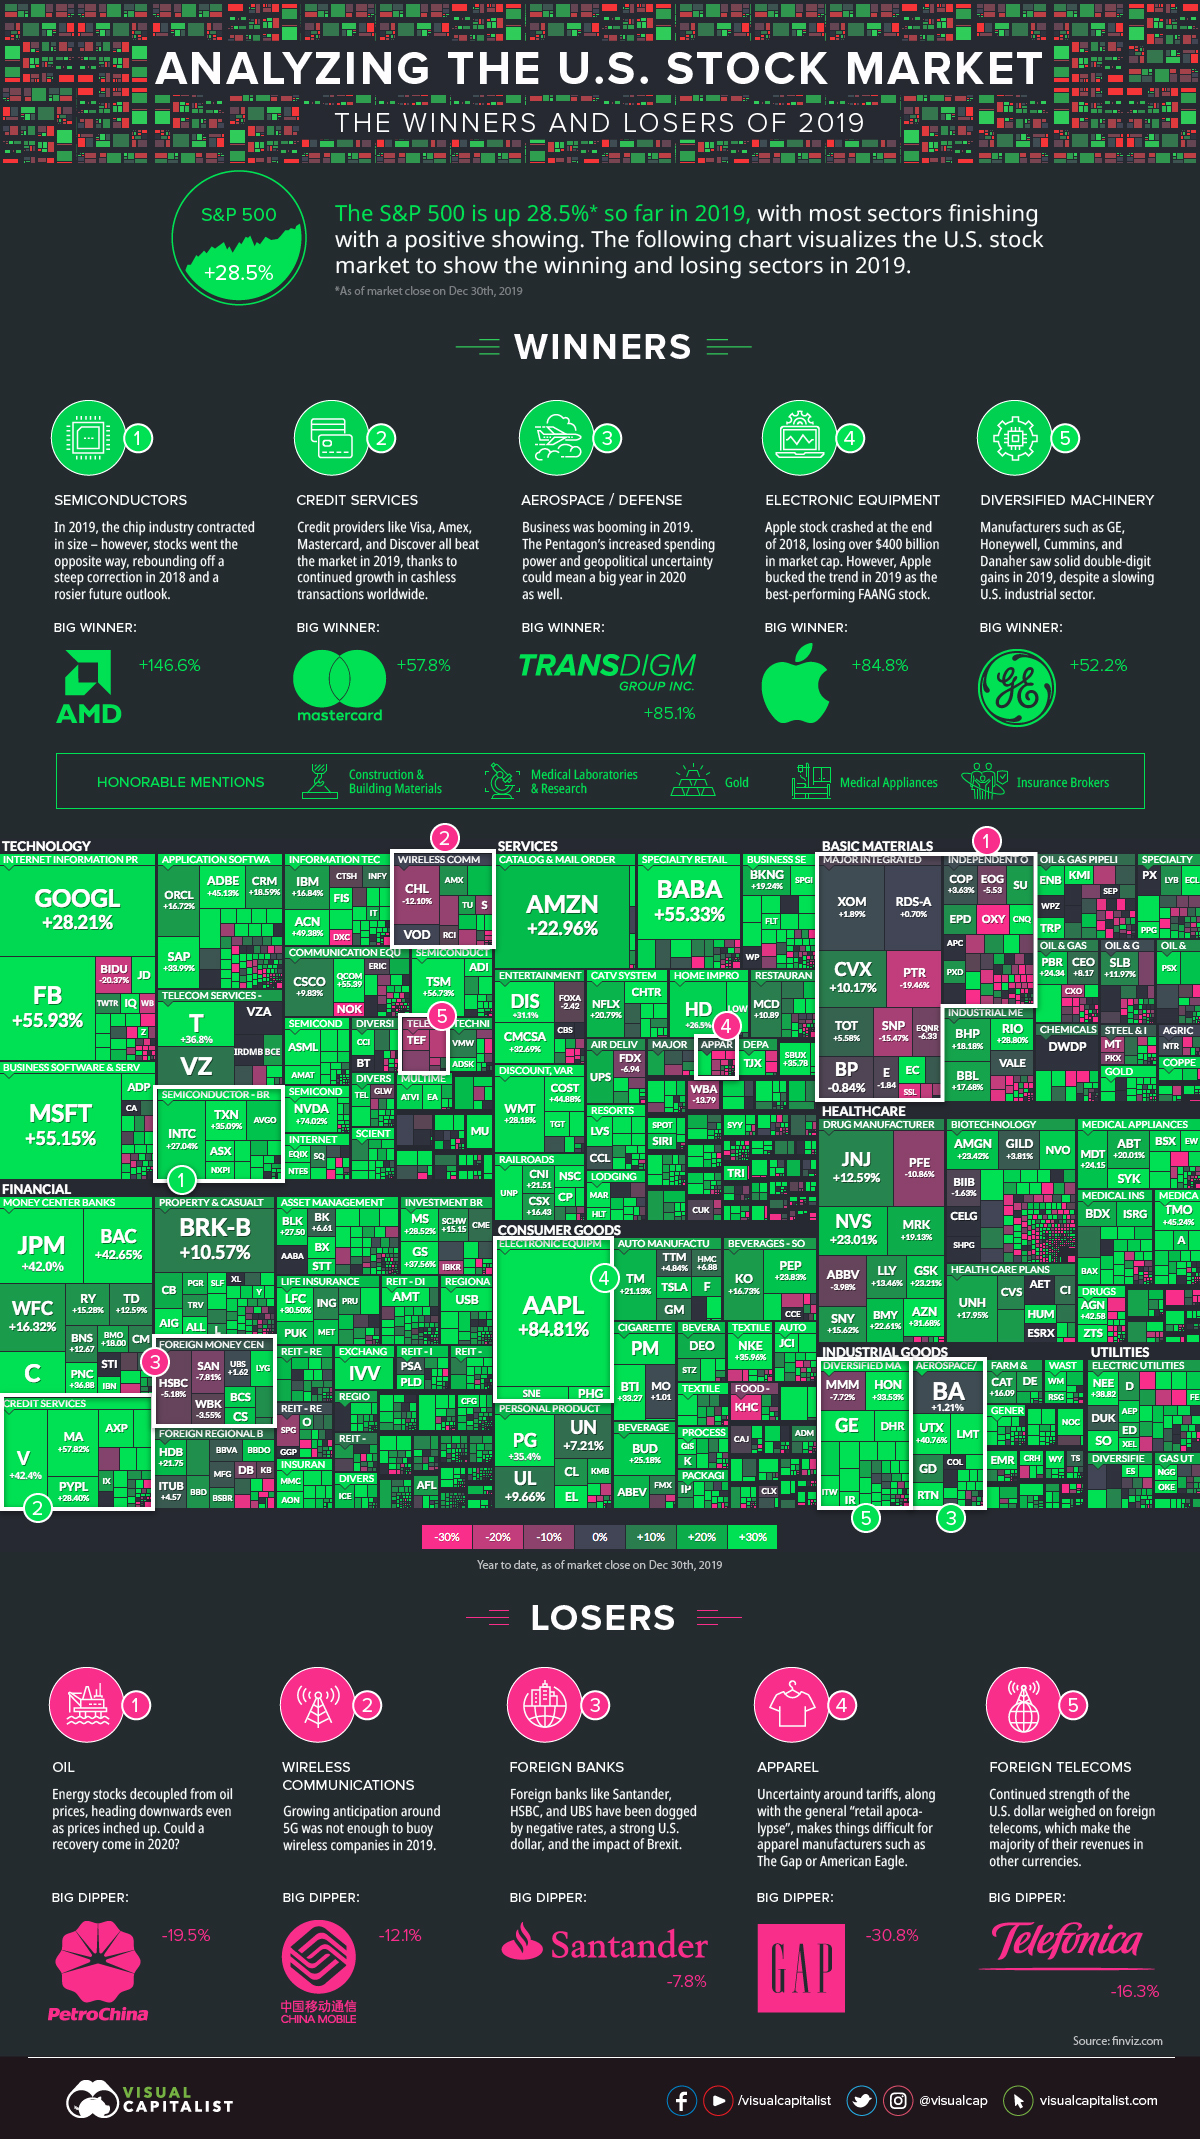
As much as the global economy has become intertwined & interdependent in the past few decades, its increased complexity and other macroeconomic & geopolitical factors might be redefining the historical relationship between different asset classes. Let’s review the performance of the U.S stock market in a little more detail with the infographic below. The data for the infographic was gathered from Finviz.com.

U.S Federal Reserve’s decision to reverse course on the hawkish stance and cutting the interest rates three times during the latter half of the year to address the uncertainties emanating from the trade war between U.S & China bore fruit as investors led the U.S market to all-time highs. The news of a resolution of the two-year-old trade dispute propelled the markets even higher in December.
The tech sector was the main driver of the stock market rally — S&P 500 technology sector, which consists of 69 stocks, up almost 50% on the year. Also the ratio of tech sector returns to S&P 500 returns is at its highest level since 2000 as pointed out by Compound Capital Advisors’ Charlie Bilello.
Winners
- Semiconductors — Despite a shrinkage in sales of 12% globally, the chip sector performed astounding well in 2019. The rebound can be attributed to the hefty market correction that we saw in 2018. The sector looks good for 2020 as the future outlook has been revised higher. Bragging rights for you if you bought Advanced Micro Devices (AMD) at the beginning of the year as it surged over 146% by the end of the year. Lam Research & KLA did well too with returns of 114% and 99% respectively.
- Credit Services — The Fintech revolution is making the world increasingly digital & cashless. This had established payment players like Mastercard, Visa, American Express, Capital One, and Discover outperforming S&P 500 in 2019. Mastercard was the biggest winner with annual gains of 57.8%.
- Aerospace/Defense — The bigwigs of this sector all performed better than the market with increased spending from the Pentagon on rising geopolitical instability. The notable exception here was Boeing, which has been plagued by the grounding of its 737 Max model in the wake of several high-profile crashes. TRANSDIGM Group was the star performer with over 85% gains for the year.
- Electronic Equipment — Apple turned out to be the Dow champion in 2019 closing the year with a gain of over 85% and a market cap of $1.3 trillion. The best performing of the FAANG stocks had a stellar year after it crashed at the end of 2018 losing $400 billion in market cap.
- Diversified Machinery — Despite a slowing U.S. industrial sector, companies like Honeywell, General Electric, Cummins, and Danaher posted solid double-digit gains for the year. It was a huge year for GE which seemed to be in a free fall in 2018 — posting an impressive return of over 52% for its stock.
Construction Materials, Medical Labs & Research, Medical Appliances & Insurance Brokers posted decent gains for the year.

Losers
- Oil — Although it was a good year for the commodity price-wise as WTI gained 36% for the year, all the companies related to Oil had a miserable year. Maybe these businesses are anticipating the waning significance of the commodity which is increasingly being replaced by renewables & a general global push towards sustainable sources. Petro-China was the biggest loser with -19.5%.
- Wireless Communications — While one would have expected the upcoming transition to 5G networks to support this sector, it didn’t really pan out that way. Banning Chinese big tech Huawei by the U.S might have something to do with the weakness in the sector, as it is involved in laying out of this futuristic network in many countries around the globe. China Mobile was dragged lower by 12.1% for the year.
- Foreign Banks — It is a tough call for foreign banks to make money right now in an ultra-low rate environment and in some cases negative rates. European banks are having an even harder time with the Brexit uncertainty & higher US dollar. The Spanish banking giant Santander posted a loss of 7.8% for the year.
- Apparel — American retailers have been hit hard by the tariffs as a result of the trade war. The exports driven sector which includes retailers like The Gap, American Eagle, Nordstrom, Urban Outfitters, and Abercrombie & Fitch all finished the year in the red. GAP was the biggest loser among the group posting a loss of 30.8%.
- Foreign Telecoms — A stronger Greenback was the culprit here as well as the majority of companies in this sector made their revenue in other currencies. Telefonica, a Spanish multinational telecommunications company lost over 16% of its value in 2019.
Marijuana stocks failed to live up to their brief hype that we saw in 2018 accumulating losses for the past 12 months — Horizons Marijuana Life Sciences ETF, which tracks companies in Canada and the U.S, recently fell to its lowest level since its launch in April 2017. According to S3 Partners, Short exposure in the cannabis sector is up 35% or $843 million in 2019.
Looking Ahead
All the leading economic indicators point to slim chances of a global recession in 2020. With the trade war winding down & Brexit uncertainty coming to a resolution, the steam might begin to pick up for a global recovery. Risks remain, however, in the form a slowing China & Germany teetering on the brink of recession.
U.S markets will most probably continue to show steady growth but nothing like the massive gains we saw this year. We did see some remarkable shifts in the global markets in 2019 and the dynamics might never be the same again.


