We all know about the Great Depression, right? It was started by the Stock Market Crash of October 1929…except that the crash didn’t actually happen in October of 1929.
At least, it didn’t if you were trying to time when the market “bounced” and began to recover.

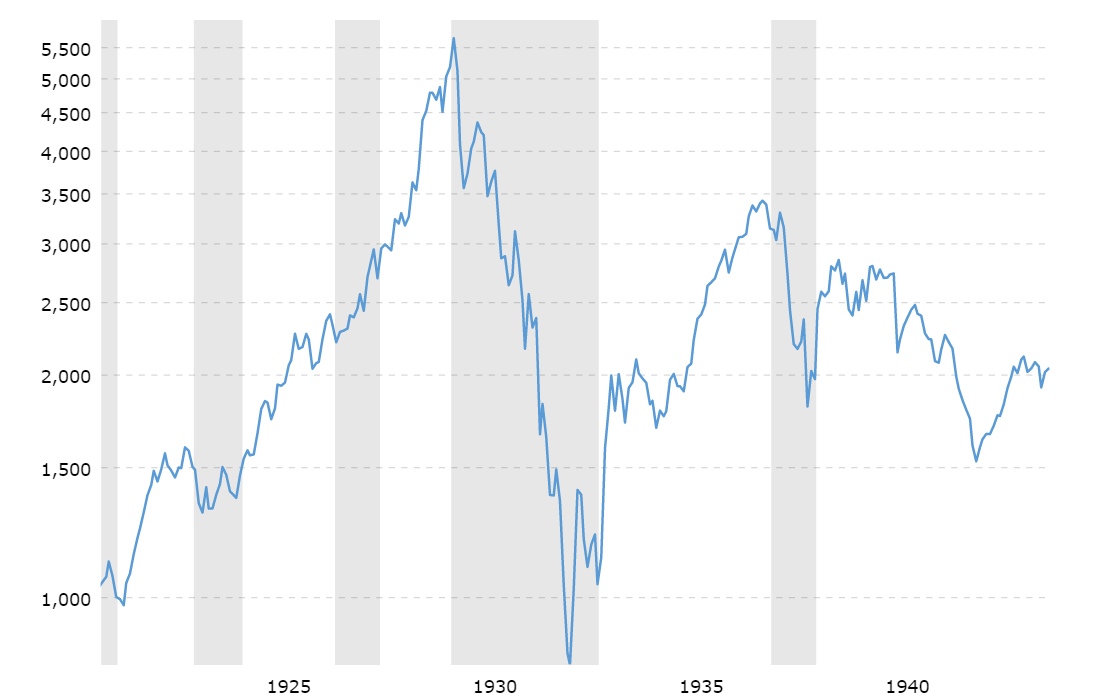
As we can see from the above chart, the historically accepted date of October 1929 as the start of the crash is a little bit misleading. While it’s true that between the DJIA’s record-breaking (at the time) high of August 1929 (5,671.48) and the beginning of November 1929 (3,563.22) the Dow did shed nearly 50% of its value, the true bottom of the market wasn’t until almost three years later, when the market grounded out at a bleak and catastrophic 812.59 in June of 1932.
Nor is this the only example of economists, financiers, and the common citizen grossly underestimating the timing of a market correction, or “bounce.” during a recession.
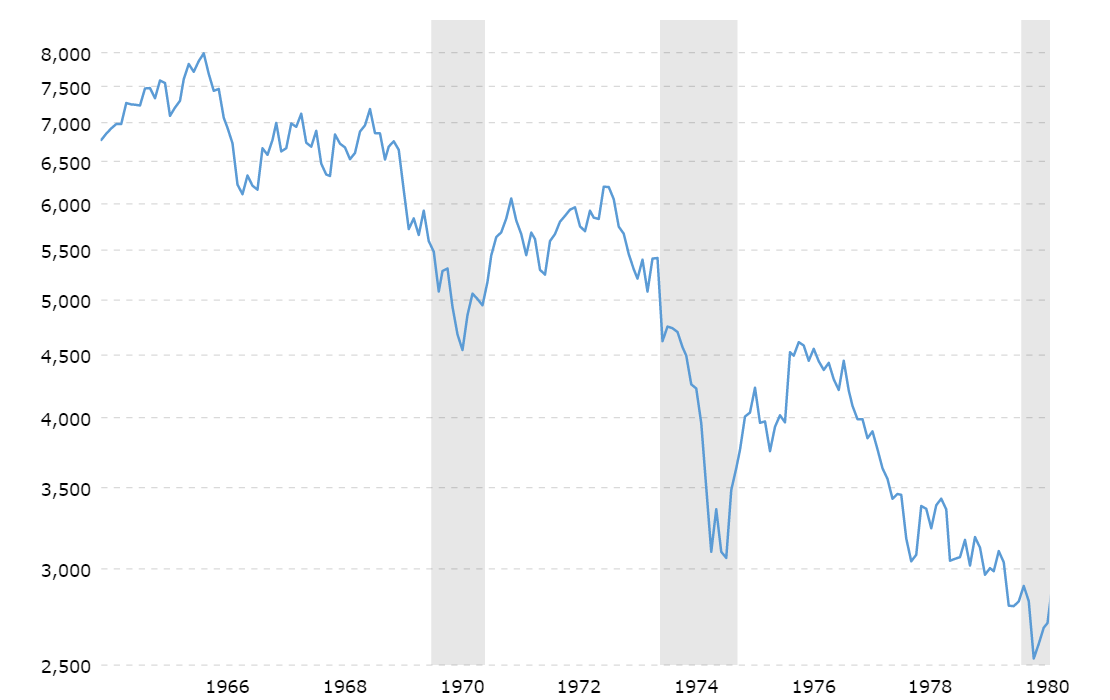
Remember the Gas Wars of 1970? Can you picture the photos and videos of miles-long stretches of MASSIVE automobiles lined up on freeways, side streets, and through neighborhoods of America, waiting for their turn at the gas pump? That uncertainty in the oil market, along with the geopolitical tensions in the Middle East (at the time the only major US oil exporter), caused another crash. Here’s what that chart looks like:

Again, if you’d bought into the market after either of those first MAJOR dips in 1970 and 1973–4, you’d have lost a ton of money before the market bounced and started to climb again.
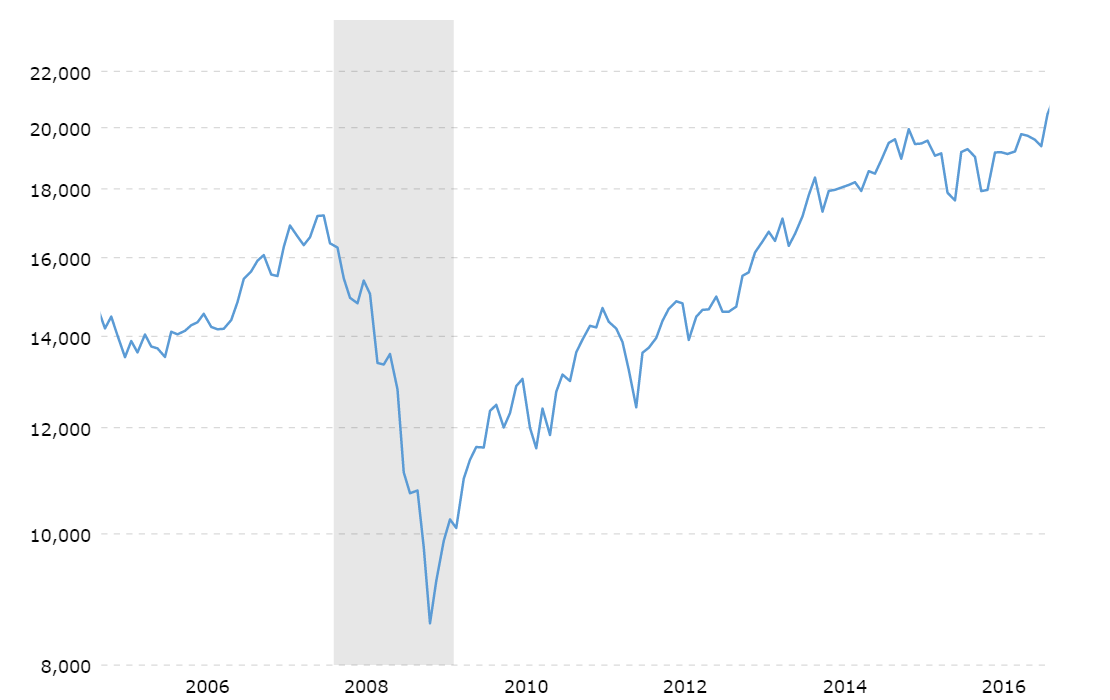
The same even goes for 2008. The subprime mortgage crisis, and corresponding nosedive in the stock market, began in mid-2008, but the market didn’t actually hit rock bottom and begin to recover until February 2009, as you can see in the below graphic:

Each of the examples above should serve as a reminder to us of how dangerous it can be to try to time the market, not only in trying to time when stocks will rise but even more so when they will fall. Many, many investors lost a lot of money in each of the major recessions of the 20th and early 21st centuries, by thinking they had timed the “bounce” correctly and that the market was on its way back up.
As we can see in the above charts, stock market declines don’t look like ski slopes, one long unbroken slide to the bottom. As governments, financial players, and individual investors en masse, make decisions to try to stem the descent, the market can pause, and even climb a bit before resuming its fall, meaning that, pardon my dark humor, most stock plunges actually look more like this:
The safest thing you can do is nothing. Just maintain your investing strategy, and continue to make contributions to your investment accounts at regular intervals. Over time, this will average out to be a much more effective strategy that minimizes your risk than trying to time any bounces or dips in the market.
If you’re a bit more willing to expose yourself to risk, however, in the hope of making more significant gains, then having a portfolio strategy that is not only “recession-proof” but actually recession-optimized is a better bet. Optimizing for a recession, i.e., taking advantage of the market downturn to either earn a profit on hedging, or to set yourself up to reap the maximum benefit when the market DOES inevitably begin to recover (which, by the way, it ALWAYS does) is a somewhat riskier, but infinitely more rewarding strategy. If you are young, and earning a regular income, and won’t need to tap into retirement income for a while, this idea of recession-optimization may be one that you want to consider. There are many great resources out there to help guide you along the way, or you can stay tuned here, as I will be writing more on the topic of recession-optimized investing tips from my viewpoint as a non-professional stock enthusiast later this week.
In conclusion, whether you decide to opt for the “best thing to do is nothing” or the recession-optimization strategies that are out there, either of those options will ultimately bear far more fruit than trying to time the dip, and risk losing significantly MORE money because the market hasn’t fully bottomed out yet. As the graphics show above, the stock market is subject to emotion, fear, and human input, not pure mathematical or financial data. Factoring in the complexity of human input into the stock market is why it’s ultimately a fool’s game to try to time ANYTHING related to the stock market.


