This article originally was published on TabbFORUM
https://tabbforum.com/opinions/the-problem-with-algo-wheels/
Algo wheels remove trader biases in algorithm selection and introduce objectivity, efficiency and automation into the broker selection process. But they tend not to account for the risk factors underlying the fat-tail distribution of algo returns, and algo parameter optimization is often a game of guessing the finer points in the algo wheel’s logic, says TABB Group senior analyst Michael Mollemans.
“Algo Wheels” were born out of a need to remove trader biases in algorithm selection and introduce objectivity, efficiency and automation into the broker selection process. Buy-side trader use of algo wheels grew significantly after MiFID II’s Regulatory Technical Standard (RTS 28) best execution reporting requirements went into effect about two years ago. Since then, the buy side’s use of broker algos has more than doubled, and algo wheels are increasingly being positioned at the front and center of the broker selection process.
The problem with algo wheels, however, is that they tend not to account for the risk factors underlying the fat-tail distribution of algo returns, and algo wheel selection processes often turn into a game of guessing the finer points in the algo wheel’s logic. The better the guess, the better the fit to the algo wheel, the better the ranking.
All in all, algo wheels need to go beyond gross median cost calculations to include standard deviation risk factors, as well as netting out market and sector betas, or the end result likely will be broker algo rankings that just oscillate between best to worst and then from worst to best along a mean reverting system over time.
Fat-Tail Distributions
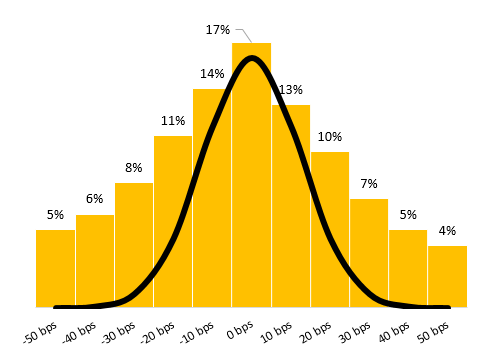
Algo wheels do not sufficiently weight the risk aspect of the fat-tail distribution of algo performance outcomes in the algo ranking equation (see Exhibit 1, below). Algo wheels typically generate broker ranking decisions based primarily on the median return number, with risk left out of the equation. They tend to discard highly distributed outliers or winsorize extreme values at an arbitrarily determined percentile level. By removing outliers, algo wheels incentivize providers to calibrate their algos to take more risk and allow for all-over-the-map performance outcomes. If the investment strategy can tolerate the risk, that is fine, as long as managers are made aware of the risk-return trade-offs.

Exhibit 1: Fat-tail distribution of VWAP performance results vs standard normal curve
Source: TABB Group
Not All Orders Are Created Equal
Consistency of algo performance results is important because not all orders are created equal. There are times when a prospective new client is performance testing a buy-side or sell-side trader over a short period of time; where algo performance across a limited test window makes all the difference between gaining or losing a new client. This reality needs to be appropriately factored into algo wheel logic so that algo quants are incentivized to maximize resource allocation in pursuit of consistency of performance across normal and non-normal market conditions.
Best Execution and Gaming
Algo sales traders aim to calibrate their algo parameters so the strategy is a good fit for the algo wheel. This is easier said than done. Buy-side traders tend not to disclose too much about the algo wheel logic because they don’t want it to be “gamed,” or manipulated to gain an unfair advantage. For example, if a VWAP algo wheel allows the participation rate to be between 10% and 15% of volume, then brokers could gain an advantage by calibrating the algo to dynamically move strictly to 10% volume when the stock moves against you and strictly to 15% volume when the stock comes into you. This strategy, if set up with sufficient precision, could earn a broker a permanent seat on the top of the algo wheel ranking because it is perfectly fit to the wheel.
Unfortunately, this is not best execution. In this case the algo is likely 1) missing natural liquidity at the mid when trying to be tight to 10%; 2) paying too much spread when trying to be tight to 15%; and 3) incurring too much opportunity cost on the residuals left due to being too tight to the low-end parameter.
Algo wheels are a game of guessing the wheel logic with imperfect information. Still, the fact remains that financial markets are unpredictable and variables such as price, volume, spread, volatility, etc., are heteroscedastic, non-stationary processes that are difficult to model; as a result, returns are often not much different from chance. Thus, brokers should expect their algo wheel rankings to oscillate from best to worst and then from worst to best along a mean reverting system over time (see Exhibit 2, below).

Exhibit 2: Algo wheel ranking expectation
Source: TABB Group
Algo Alpha Attribution
Financial markets are unpredictable and thus the road ahead for algo wheels is in finding a balance between best fit and best execution goals, as well as fine-tuning statistical methods used in algo excess return attribution. Too often algo wheels, or other automated algo ranking systems, use simplistic normalization techniques that can produce consistency in the results but miss the bigger best execution picture.
Excess returns need to be used across all measures in order to remove the market and sector betas and focus on the algo alpha attribution. In other words, subtract the market and sector betas from the actual gross returns, to be left with algo alpha excess returns. Then, subtract out the pre-trade excess return model estimates. This is one of a number of methods that can be used to more directly focus on algo alpha and reduce the mean reversion process in rankings when the market and sector betas are left into the performance equation.
The Road Ahead
The road ahead for algo wheels is to help facilitate deeper discussions around the shared goal of best execution, in light of client risk tolerances. Although minimizing risk by tightening the distribution of performance outcomes sounds reasonable, some investment strategies may prefer risk taking and fat-tails in the short term, if excess returns are possible over longer time horizons. At the end of the day it is critical to know what is going on under the hood of the algo wheel – to have all the risk and return data available to make decisions with clients around risk and return preferences.
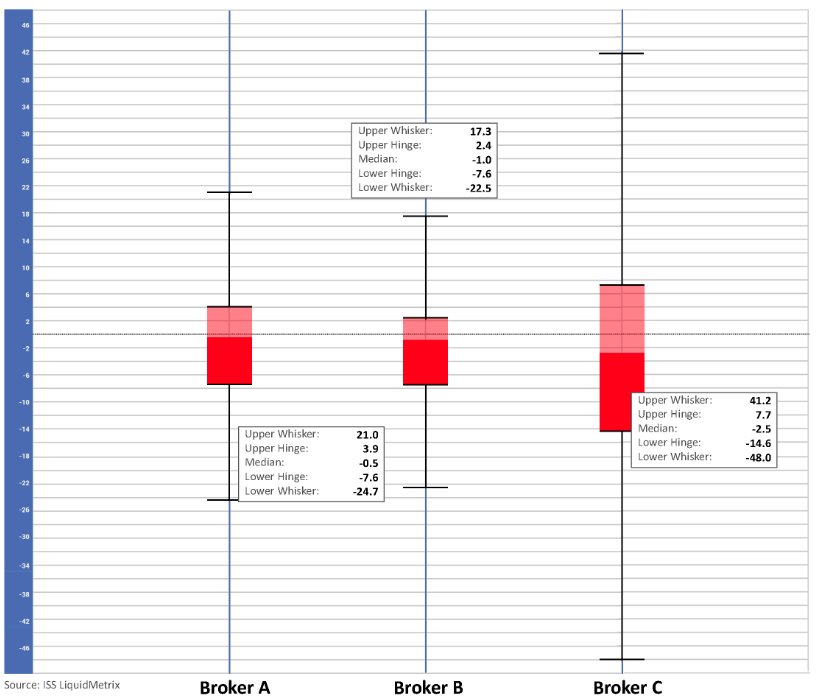
Data visualization tools, such as box and whiskers charts, can help buy-side traders better understand the risk and return tradeoffs taken by the strategy selection and algo allocation decisions of their algo wheels.
“Tools to help visualize the distribution of cost outcomes can help buy-side and sell-side traders have deeper discussions about their performance goals” – Henry Yegerman, ISS LiquidMetrix (See Exhibit 3).

Exhibit 3: VWAP cost distribution – box and whiskers chart
Source: ISS LiquidMetrix
Only when buy-side traders fully understand the risk-return trade-offs implicit in their algo wheel processes and calibrations can they truly have full control of their order flow consistent with the firm’s best execution objectives.


