


By Arnaud Bossard, Senior Quant Analyst, BMLL

The US equity options market continues to grow, fuelled by macroeconomic uncertainty, market volatility and increased investor demand. As with any electronic market, understanding microstructure and execution dynamics is critical, whether it’s for alpha generation, optimal execution or risk management. However, the sheer size and scale of the US options market, where exchanges process hundreds of billions of messages a day (and a trillion during recent market volatility), can make performing this analysis a considerable challenge.
In this article, we take a look at some of the key features of the US options market, and how market participants can leverage the right data to better understand the market, whether that is for traders and researchers generating alpha, brokers looking to improve execution, or exchanges looking to better understand market structure.
Market basics
The US equity options market is highly fragmented. There are 18 different exchanges, offering different fee structures, matching engines and trading mechanisms. This fragmentation is expected to continue, with new exchanges set to launch. Importantly, unlike equities, all trades in equities options occur on exchange.
On these exchanges, you can trade multiple different expiries and strikes on various underlying asset classes:
- Indexes (e.g., S&P 500, VIX) – 700 different indexes on total
- ETFs (e.g., SPY, QQQ, IWM) – 1500 ETFs
- Single stocks (e.g., AAPL, TSLA, NVDA) – more than 3500 Single Stocks Options
These options can have a variety of different expiries – weekly, monthly and quarterly.
- Quarterly expiries: found in index options and some ETFs.
- Monthly expiries: available for index, ETF and single-stock options.
- Weekly: popular for high-liquidity underlyings (SPY, QQQ, IWM, AAPL, TSLA, NVDA).
- Daily: high liquidity ETF and index options
The combination of products, strikes, options types and expires results in more than 1.5 million contracts that are actively quoted and traded on any given day, with over 200 billion trade and quote messages disseminated through OPRA (the US equity options consolidated tape) every day. This makes processing and analysing OPRA data incredibly challenging to do at scale.
Leveraging trades and NBBO updates from a high quality historical OPRA data feed, we now look at some of the key trends of the options market, and examine how firms can use this type of analysis to better understand the US options market.
Traded volumes
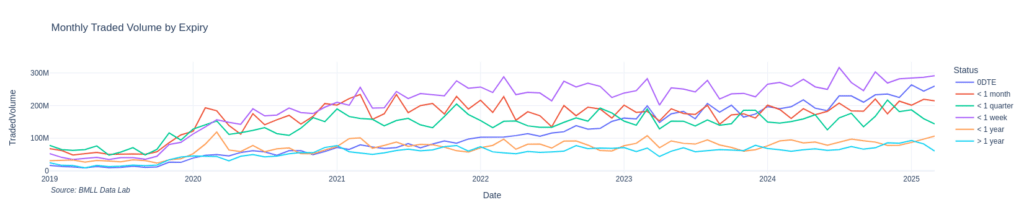
The options market has grown considerably in recent years, as shown in figure 1. One important factor in this has been the increased uptake of short term expiry trading, especially options that expire the same day (“0DTE” options). As we can see in figures 2a and 2b, 0DTE trading is now a significant proportion of the overall equity options market.
Fig 1 – Average Daily Trading volume per month
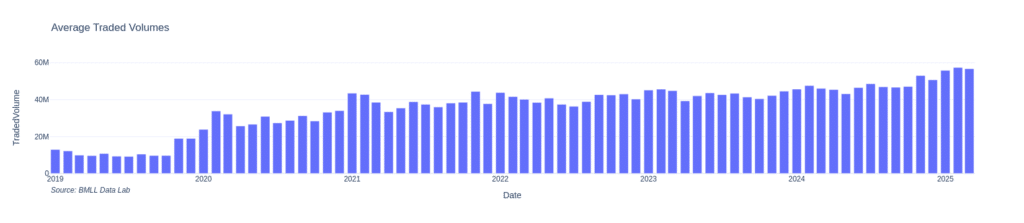
Fig 2a – Breakdown by Expiry range – stacked barplot
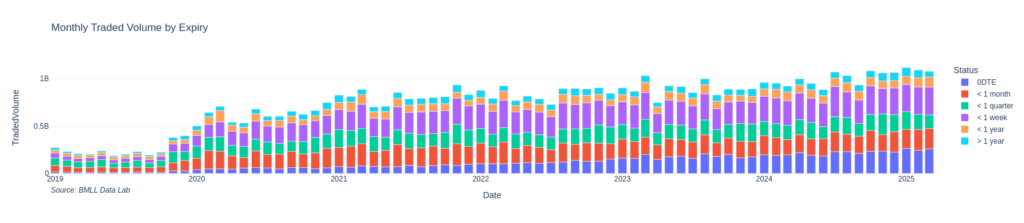
Fig 2b – Breakdown by Expiry range – comparative line plots
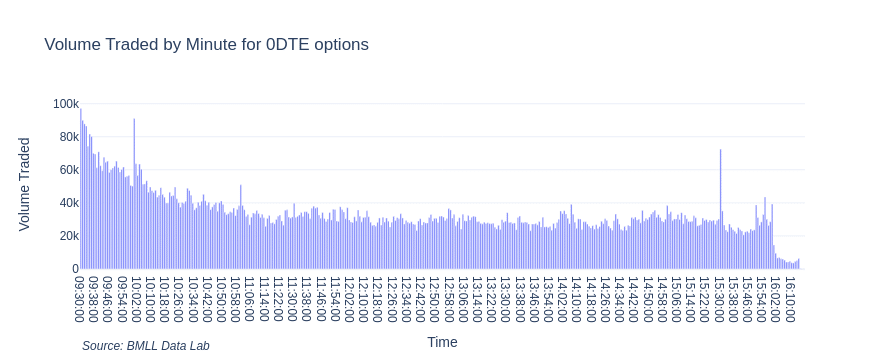
Since 0DTE options now make up a significant portion of overall trading, an important question is how do they trade? Typically, most trading on exchange displays a typical “smile” curve, with more volume at the start and end of the day (as shown in figure 3a).
Fig 3a – Intraday Trading Profile for Non-Daily Options
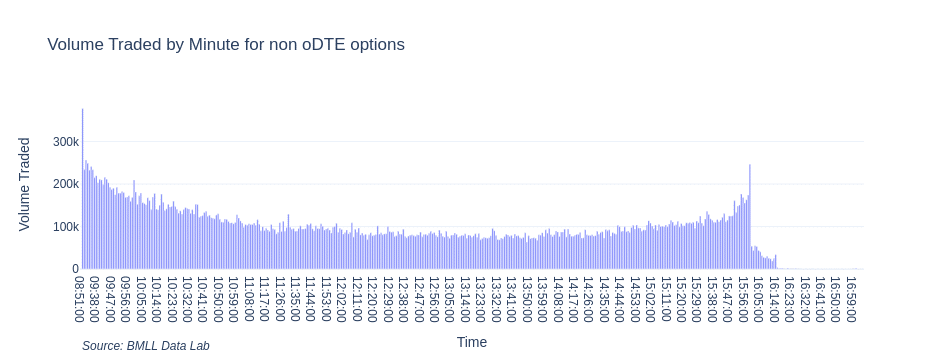
However, since 0DTE options expire at the end of the day, we see the behaviour is different, with a steeper drop off in the morning, and then consistent trading volumes throughout the rest of the day, as we can see in figure 3a. As these options near expiry at the end of the day, this type of information can be used to determine how and when to trade 0DTE options.
Fig 3b – Intraday Trading Profile for Daily (0DTE) Options
What types of options are traded?
Whilst overall volumes have increased, an important question is what is being traded? From figure 4a, we can see the breakdown by asset class and underlying. We see that, regardless of asset class, volumes are concentrated on a few underlyings. This is especially true for ETFs and index options, where trading is focused on a few large names (such as SPY and S&P 500 index).
Figure 4a – ADV by product – computed YTD in 2025 by aggregating total size traded across all options

Looking at single stocks in more detail in Figure 4b, we see a more even distribution. However, it is still relatively concentrated in the mega cap equities, and actively traded stocks like the Magnificent Seven (NVDA, TSLA, AAPL, META, AMZN, MSFT and GOOGL) are all highly traded.
Fig 4b – ADV by product – for Equities only

This suggests that, whilst the options market is very large, the majority of activity is occurring in a small number of contracts, the same that are most heavily traded on the equity side.
Understanding fragmentation
With 18 options exchanges in the US (and no dark pools), we now look at how different exchanges trade options. In figure 5, we show average traded volume broken down by asset class and exchange.
Fig 5 – Total Daily Volume traded by Venue averaged on Q1 2025
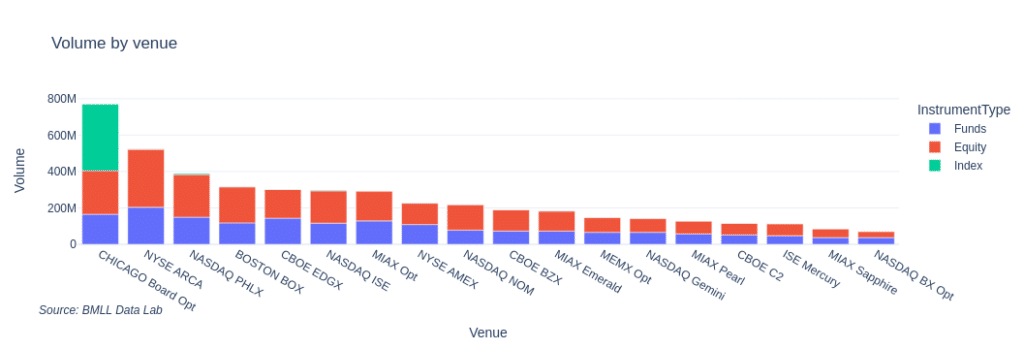
From the charts we see a few trends:
- Whilst equity and ETF options are fragmented across a number of exchanges, Index options are highly concentrated on a single venue
- Whilst major exchanges (such as CBOE, NYSE Arca and Nasdaq PHLX have strong market share, there is a long tail of venues with significant market share
In the equity markets, market share is often correlated with time at NBBO (how often a venue is quoting the National Best Bid and Offer Price). However, here we see an important difference with options. In figure 6, using TimeAtNBB/NBO fields in BMLL’s historical OPRA datasets, we rank venues by the Time at NBBO averaged on all the options.
Fig 6 – Average Presence at NBBO by Venue
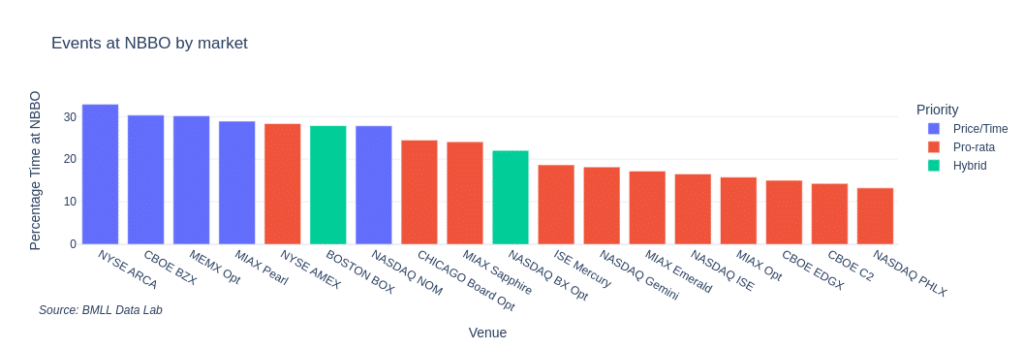
We see that the most present markets are typically the ones with a Time priority execution mechanism compared to Pro-rata. This highlights an important part of options market structure – understanding how each exchange behaves is important when trying to determine best execution and the best way to trade. With more options exchanges set to be launched (IEX has stated it will launch an options exchange, and MEMX has regulatory approval to launch a pro-rata exchange), it will be critical for firms to continue to analyse this.
Retail trading
Retail trading has seen a dramatic rise in recent years, particularly since the COVID pandemic. The emergence of commission-free brokers such as Robinhood, coupled with high-profile events like the GameStop (GME) short squeeze, drew an unprecedented wave of individual investors into equities and, crucially, into options trading. Indeed, unlike stocks, options provide leverage, allowing to control a larger position with a smaller capital, leading to potential higher rewards, but also higher risks.
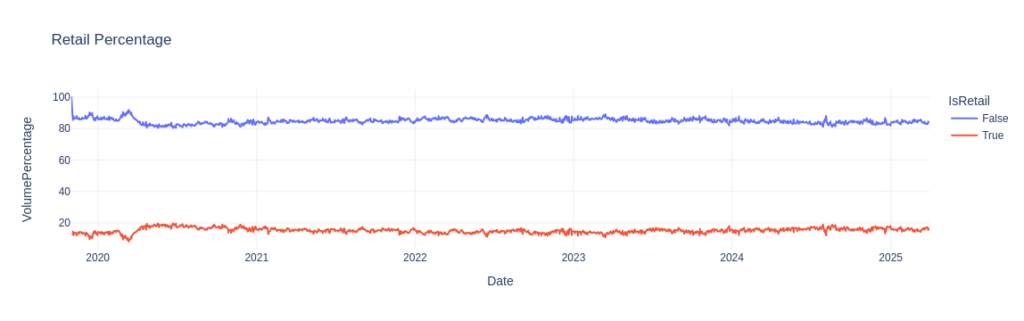
The OPRA data feed does not provide a direct flag to identify the retail trading. However, one standard definition is to analyse transactions executed through SLAN (Single Leg Auction Non-ISO), a trade style linked to price improvement auctions. As explained in the recent paper by Bryzgalova et al regulatory requirements in the US lead brokers to provide price improvements through those auctions to Retail investors. We can therefore use SLAN trades as an approximation for retail trading.
By this definition, retail trading is approximately 15-20 percent of traded volume, as shown in figure 7b.
Fig 7a – Retail Volumes Evolution (SLAN mechanism)
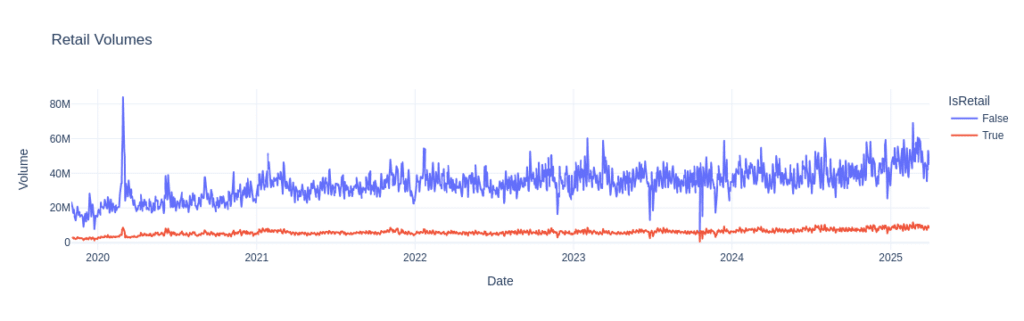
Fig 7b – Retail Percentage Evolution (SLAN mechanism)
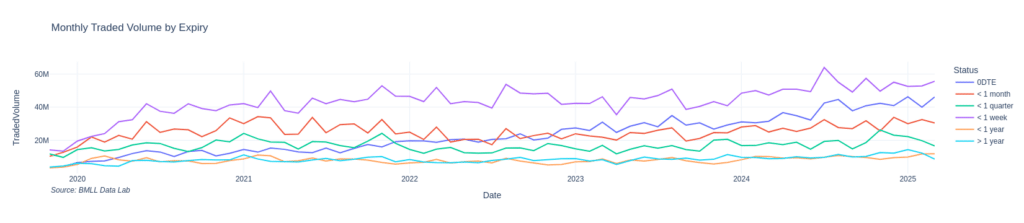
Furthermore, repeating our analysis on the expiry date of options, we find a larger share of options trading that are short term (either 0DTE or less than 7 days), as shown in figure 8.
Fig 8 – Breakdown by Expiry range for Retail Trades
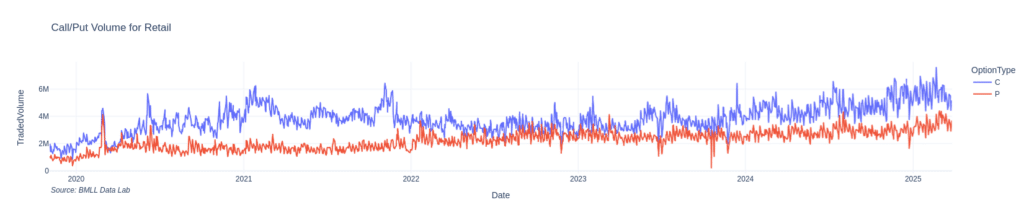
Finally, we can look at whether puts or calls are being traded by retail participants. We see that there are significantly more calls being traded than puts for retail (figure 9a).
Fig 9a – Call vs Put: Traded Volume Evolution for Retail
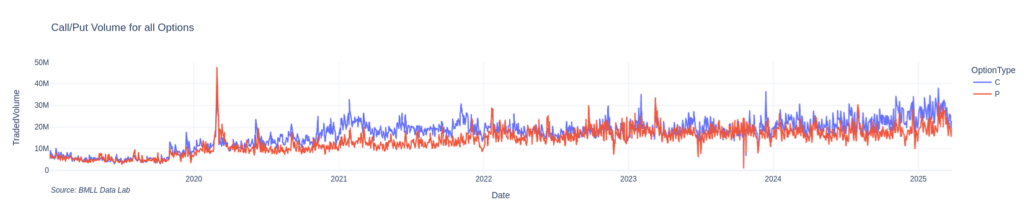
This is in contrast to non-retail trading (figure 9b), which has a more even distribution of puts and calls. This can be explained by retail trading short term speculation, as opposed to hedging, which would be typically traded via a put option. We therefore see that retail is about 15-20% of the market, and typically trading shorter term call options. Given the behaviour of retail can be quite different from institutional flow.
Fig 9b – Call vs Put: Traded Volume Evolution for non-Retail
Leveraging OPRA data to achieve efficient execution at scale
Given the scale of the US options market, understanding the market structure and how it behaves is critical for anyone trying to execute efficiently or find alpha in that market. The challenge, however, is how to answer these basic questions given the volume of market data that is produced every day.
By leveraging well-structured OPRA trades and NBBO historical data in a scalable cloud environment, answering these types of questions is possible. This allows us to understand the composition of options trading volumes, the intraday trading profile of 0DTE options, and how retail participants behave, making it easier to efficiently trade the US options market.

