By Phil Mackintosh, Senior Economist, Nasdaq
There are four rules in Reg NMS that specifically work toward protecting retail investor executions.
- Rule 604: requires that limit orders are “displayed” so retail doesn’t miss any fills.
- Rule 605: requires trading centers to measure where orders are filled versus the NBBO at the time of execution, which makes sure retail doesn’t get bad prices.
- Rule 606: requires disclosure of where orders are routed, so retail know where their brokers are looking for liquidity.
- Rule 607: requires disclosure of payment (PFOF) arrangements between trading centers and brokers, reducing a potential conflict of interest.
As we highlighted earlier this year, 606 and 607 refer to “customer orders,” which are capped at $200,000. While rules 604 and 605 apply to “covered orders,” which are typically measured in shares, which FINRA guidance has capped at 10,000 shares.
Interestingly, “block size” rules in Reg NMS, which typically define a large institutional order size, apply to the “lesser” of 10,000 shares or $200,000.
Most retail orders are small
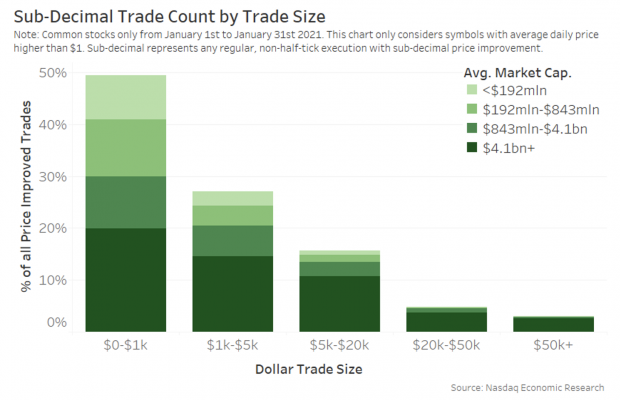
We could ask, “Why the difference?” Especially given our research seems to indicate that retail trades are typically much smaller than $200,000. In fact, we estimate that more than 92% of retail orders are for less than $20,000.
Chart 1: Estimated average retail trade size in dollars
But it’s also interesting to ask, “What does it matter?”
Share prices are rising
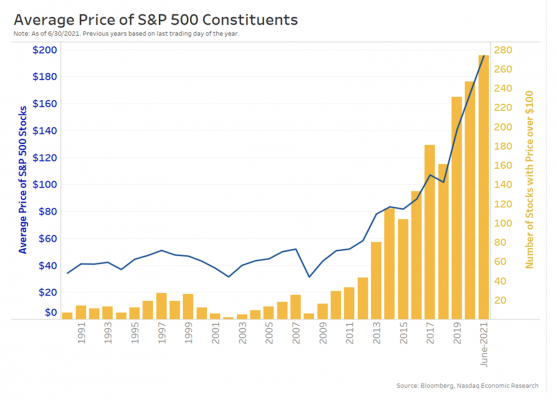
To answer that question, it’s first important to note that old research indicated that companies would split stocks so that their share prices remained in a constant range at around $40. Notably, one study suggests the average stock price we see below remains near $40 back as far as 1940.
In short, it is starting to matter much more.
Since automation of the markets occurred in the early 2000s, indexes are market cap-weighted, and algorithms work orders and computers settle trades – leading to a reduction in the demand to split stocks – despite other good reasons to do splits.
Chart 2: S&P share price growth
That means that 605, with its share-based buckets and caps, actually includes some very large trades. As Chart 3 shows, a $10 million trade in a $2,000 stock (purple color) would be measured against a $10,000 trade in a $2 stock.
Chart 3: How 605 works now, computing effective spreads in share-quality groupings that don’t correspond well to trade size, difficulty or retail order sizes
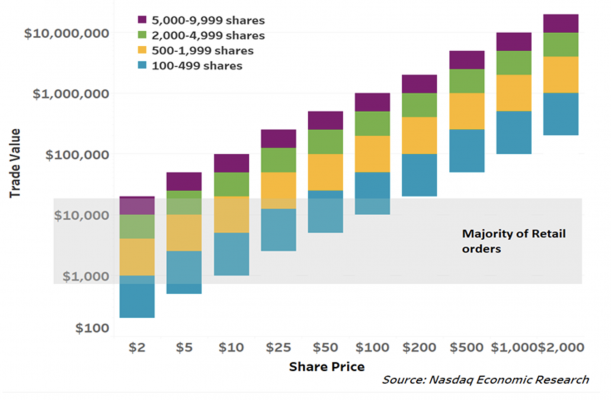
Perhaps more importantly, 605 excludes odd lot orders. For many high-priced stocks, that means execution quality for many retail trades isn’t even calculated. As Chart 3 shows, trades below $10,000 in a $100+ stock aren’t included.
One academic study indicates that not measuring odd lot trades EQ (below 100 shares) results in materially different execution quality with less (but still some) price improvement (blue dots in Chart 4).
Interestingly, that study also found that on-exchange executions of odd lots actually received better price improvement than on-exchange orders over 200 shares (red dots) because a higher proportion of those orders “bumped into” hidden orders inside the NBBO, which is consistent with our own studies.
Chart 4: Comparing price improvement by trade size in shares (note the source for how to interpret this score)
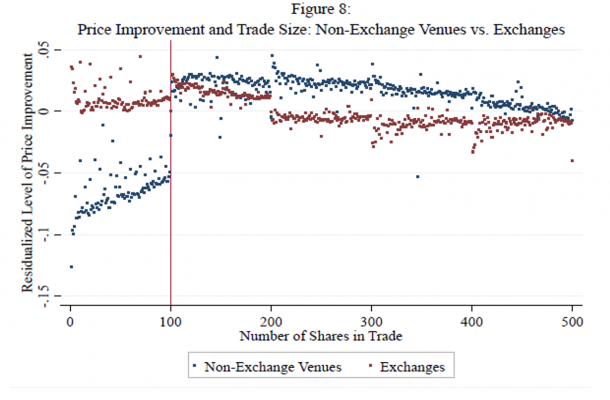
Source: To understand what statistics this chart is showing see: Modernizing Odd Lot Trading, Bartlett (2021)
Note that this is different from the problem caused by odd-lots not making up the NBBO, which of course is used as the Price Improvement benchmark in 605 calculations. That is a separate issue the market is working through.
Wouldn’t it make sense to reset 605?
We aren’t the first to talk recently about modernizing 605. A number of industry proposals have already joined this debate.
In fact, a FIF comment letter included a number of proposals to address some of these issues, from including odd lot customer orders in 605 groups to notional buckets capped at $500,000. They also propose a new size improvement metric for orders larger than the NBBO, as well as shrinking reported times to be more consistent with how fast markets trade now.
Citadel also recently proposed adding odd lot quotes(prices inside the NBBO) to execution quality calculations.
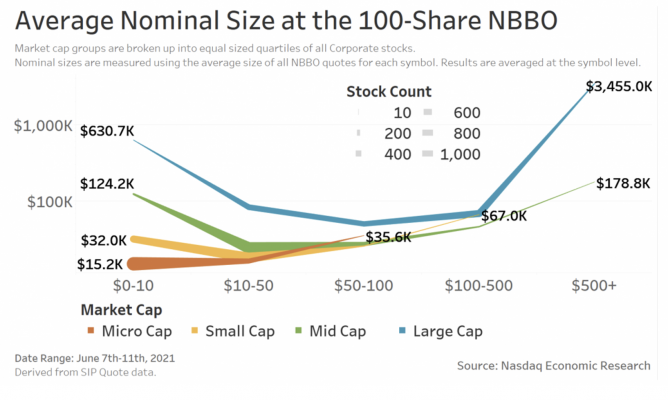
To account for obligations created by very large held (covered) orders, a few have suggested taking that concept further by computing EQ on a “virtual sweep” of lit exchange depth – sweeping enough levels until the retail order would fill (virtually) on-exchange and computing the average price that would receive. However, our research indicates that approach would overstate price improvement, especially on very large orders in higher-priced stocks:
- While the average value on the NBBO is typically lower than $100,000, a $10 million order might need a virtual sweep of 100 levels of lit order books, based on what depth data shows us.
- That would likely undercount hidden shares and better prices, making the new EQ benchmark wider than an actual exchange sweep.
- It would also exclude liquidity that would naturally come to market if such a large order were instead “worked” for a customer, as brokers do now for institutional customers, in order to reduce excessive trading costs.
Chart 5: Average depth by share price and market cap
How might a new notional grouping of orders work?
Higher stock prices have created some obvious problems with the current rule: missing odd lot orders and prices, and accounting fairly for very large orders that are “covered” under current definitions.
There are benefits to a FIF-style solution, especially if you include “all orders up to” a specific value, as that would include odd lot orders. It could even include the growing proportion of fractional share executions.
And a lower notional cap makes sense too, given the small sizes of retail orders, especially when we consider the limits of the typical depth of book to fill covered orders. It could even help wholesalers with the problem of being held on large covered orders and become more consistent with how institutional orders qualify for block rules, allowing special handling of them already.
What cap size would be appropriate?
Interestingly, the current rule 605 is consistent with the block size (shares) rule – so it would make more sense to switch to the block size (value) rule. That’s currently $200,000, although that’s a number that hasn’t changed with inflation.
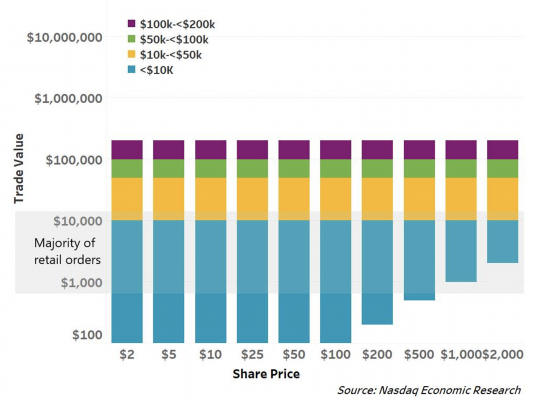
As an example of how this might work, we can compare Chart 3 (605 now) with Chart 6 (below).
Importantly, the notional order groupings used for EQ comparisons better reflect order difficulty and cost, as each group is more closely aligned with typical lit book depth.
Chart 6: What notional 605 buckets could look like
This is just one of the issues the industry is focused on right now, and yet another rule set for the SEC to consider. Having data hopefully helps us work through whether these ideas fix more problems than they create.


