One of the reasons often used to justify the access fee pilot is that rebates paid to liquidity providers are so good at attracting lit quotes that they lead to long queues, and institutional investors struggle to get to the top.
However, todays data show big queues are actually a pretty small problem.
Queue size for large-cap stocks
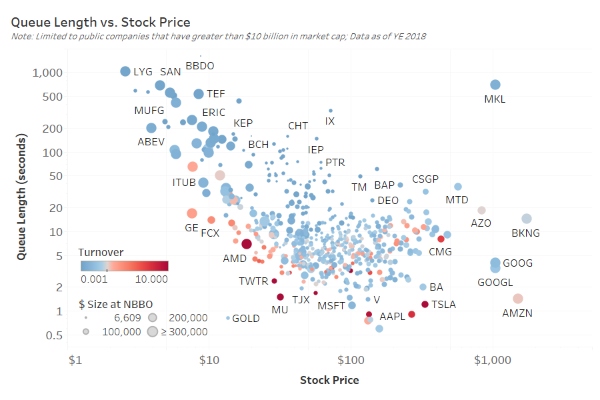
The chart below shows a simple average time it takes for the National Best Bid and Offer (NBBO) to trade, based on the stock price and value on the NBBO for each stock. The vertical axis is time to trade the NBBO in seconds, with most of the circles (large-cap stocks) under the 20-second level. This means the NBBO for most symbols cycles at least three times per minute. Thats not very long for a passive order to wait for a fill.
That shouldnt be surprising. The typical (median) quantity on the NBBO of these large-cap stocks is just 571 shares. Thats a different concern for some, although as our V is for Volume study discussed, it is a function of how small spreads actually are in these stocks, which in turn has been shown to reduce trading costs.
Chart 1: Comparing average simple queue time across large cap stocks

Source: Nasdaq Economic Research
Its no wonder smart traders use inverted venues for low priced stocks
The data show large-cap queues increase significantly below $20 per share stock price, which is consistent with our prior analysis of tick-constrained stocks and their artificially wide spreads.
Not surprisingly, this is also where we see market fragmentation increase, as smart traders use inverted venue economics to counter longer queues and wider spreads in basis points, effectively creating two price levels at the NBBO, with different queue times for each venue.
Thats also where our simple average queue time used in Chart 1 becomes less useful, as new orders routed to inverted venues should consistently get filled before maker-taker orders resting for longer.
Why is this important?
Not all tickers have the same level of opportunity cost for posting passive orders. The long-queue stocks most likely incur more opportunity costs from posting on maker-taker venues, especially for investors with some urgency. Even within maker-taker, missed fills may vary by venue.
This in turn means that not all investors are affected by rebates equally. Its also possible that some investors are actually better off on an after-commission basis, even if they are using rebate collection algorithms. That’s why its important to measure outcomes properly.
In that context, we will highlight that large-cap tickers with queues above 60 seconds add up to less than 1% of all U.S. equity value traded. Combine that with the fact that one of our latest posts estimated only around 5% of trading is actually institutional investors. It indeed seems big queues might be a relatively small problem.


