Over the past 6 months, there have been numerous discussions on how Bitcoin and crypto could fit into an overall investment portfolio.
Much of this has stemmed from the growing narrative that Bitcoin is a hedge against global instability, as well as the uncorrelated nature of Bitcoin compared to equity and bond markets. However, with Bitcoins YTD average daily volatility of 4.11% and a peak-to-trough drawdown of 84% in 2018, the most common question potential investors ask is: what is the best way to size a Bitcoin position within a portfolio?
By looking to the Markowitz Modern Portfolio Theory, where we use efficient frontiers and capital allocation lines to take a mathematical approach to sizing a Bitcoin position into a larger portfolio, we can observe the impact of a Bitcoin allocation to a balanced allocation that is 60% stocks and 40% bonds.
Efficient Frontiers
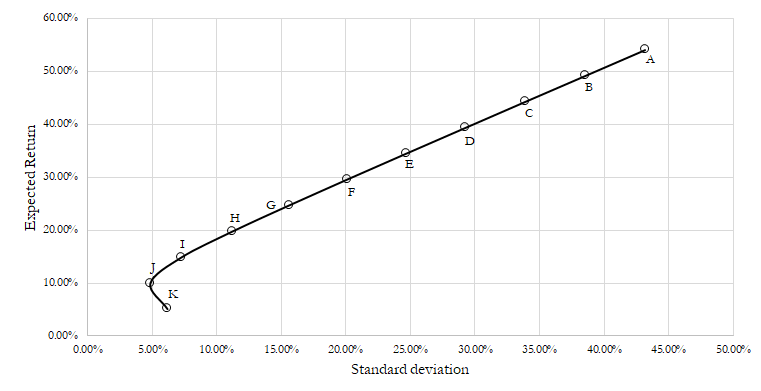
The below graph shows a graphical representation of possible portfolios between two assets: Portfolio Expected return (E(r)) on the Y-axis and Portfolio standard deviation (SD) on the X-axis. It also shows how a portfolio can be impacted by adjusting the allocation weighting, allowing an investor to determine where they want to be positioned on a risk-reward spectrum.
Asset 1: 60/40 Portfolio
Asset 2: Bitcoin
60/40 Portfolio and Bitcoin Efficient Frontier

To get a better understanding of what each portfolio represents, we can look at the table below to see each portfolios corresponding weights, as well as expected returns and standard deviations.
|
Efficient Frontier |
E( r ) |
SD( r ) |
||
|
Portfolio |
Bitcoin |
60 40 Portfolio |
17.36% |
9.16% |
|
A |
100% |
0% |
54.10% |
43.20% |
|
B |
90% |
10% |
49.20% |
38.55% |
|
C |
80% |
20% |
44.30% |
33.91% |
|
D |
70% |
30% |
39.40% |
29.28% |
|
E |
60% |
40% |
34.50% |
24.67% |
|
F |
50% |
50% |
29.61% |
20.10% |
|
G |
40% |
60% |
24.71% |
15.59% |
|
H |
30% |
70% |
19.81% |
11.22% |
|
I |
20% |
80% |
14.91% |
7.27% |
|
J |
10% |
90% |
10.01% |
4.85% |
|
K |
0% |
100% |
5.11% |
6.18% |
We can interpret the above data in a few ways. Anything above the vertex represents an efficient portfolio allocation with higher risk and higher expected returns the farther up the Efficient Frontier one goes. However, anything below the vertex of the curve can be considered an inefficient portfolio allocation. This is simply because these portfolios have a lower expected return with a higher level of associated risk.
Finding the Optimal Portfolio
There are two portfolios that we should consider when thinking about allocation based on the Efficient Frontier:
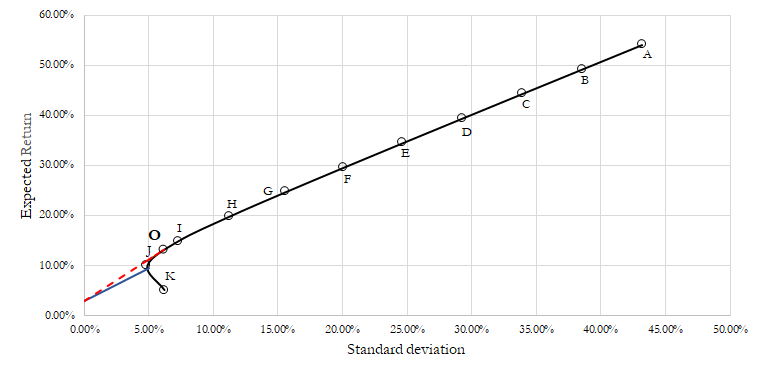
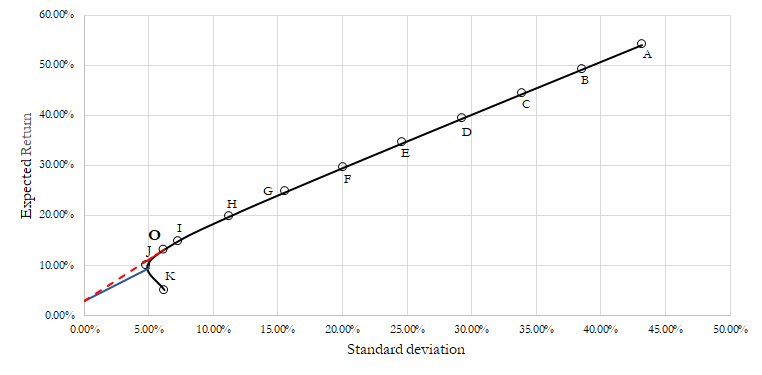
Minimum Variance Portfolio: The solid blue line at the vertex of the Efficient Frontier represents which portfolio has the lowest variance and therefore lowest expected risk.

This portfolio calls for a 9.56% allocation to Bitcoin, 90.44% allocation to 60/40 portfolio. This allocation would lead to an expected return of 9.19%, a standard deviation of 4.79% and an expected portfolio Sharpe ratio of 1.29. This portfolio on its own significantly outperforms a traditional 60/40 portfolio which has an average annual return of 7.8%.
Optimal Portfolio: The red dashed line on the graph, Portfolio O, represents where the Sharpe Ratio of a portfolio along the Efficient Frontier would be highest. In other words, it shows when the ratio between expected returns and standard deviation are highest.

The Optimal Portfolio calls for an allocation of 14.21% Bitcoin, 85.79% 60/40 portfolio. These weights would lead to an annual expected return of 13.25%, a standard deviation of 6.16%, and a Sharpe ratio of 1.66. This allocation significantly outperforms the average annual returns of the average 60/40 portfolio, and also the average annual returns of the S&P 500 (9.8%).
Perhaps, most importantly, based on the growing instability throughout the worlds monetary policies and ongoing political unrest, both of which the Arca team has discussed previously, the Optimal Portfolio has a significantly lower standard deviation than the S&P average of 12.53%.
It goes without saying that a 15% allocation into an incredibly new asset class is likely too large for most investors, especially those with significant resources at their disposal. That said, this number is the product of the model only taking into consideration a 60/40 portfolio.
With the likely inclusion of real estate, private equity, and gold positions, the projected allocation would likely decrease. But the uncorrelated nature of Bitcoin still offers similar benefits in terms of increased expected returns and a decrease in overall risk in any size portfolio.


