The following is contributed content from Nasdaq and written by Phil Mackintosh
It’s easy to think that all large-cap portfolios are the same. But are they?
The recent COVID-19 selloff shows how different the Nasdaq-100 is in some important ways that have helped it outperform during the selloff.
Large-cap portfolios down 13% YTD
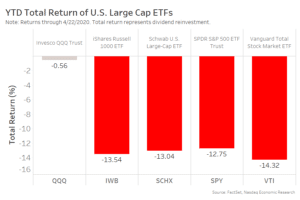
Year-to-date equity markets have clearly been tough. When we look at the performance of most U.S. large-cap ETFs we see that most are down around 13%.
However the Invesco QQQ ETF (often referred to as QQQ or the QQQs), the largest ETF globally tracking the Nasdaq-100 Index, has outperformed significantly by being close to flat on the year as can be seen in Chart 1.
This reflects the Nasdaq-100’s different index rules and resulting portfolio selection. It also provides insight into how different companies are expected to fare in in the post COVID-19 world.
Chart 1: Comparing Large-cap U.S. ETF performance
The similarities in other ETF returns also highlight how little difference there is in a classic float-weighted large-cap index. Although these top ETFs track different indexes—Vanguard’s ETF follows CRSP’s index rules, SPY follows S&P’s, iShares IWB tracks Russell indexes and Schwab makes its own indexes—the portfolios they track are really very consistent.
That’s because most large-cap indexes include all available companies at free-float weights. Usually that means significant overlap in what stocks qualify as “U.S. companies.” Although S&P has additional subjective inclusion criteria, which includes a requirement on profitability.
Why is the QQQ so different?
Turns out sector and stock selection in the QQQ makes a big difference to the portfolio and returns in a market like we have now.
To understand why the QQQ is so different requires an introduction to the unique Nasdaq-100 index rules.
- First, the Nasdaq-100 includes only Nasdaq listings. So many of the companies in the index are the new-economy, technology focused firms that Nasdaq is known for. As we all work from home, the technology sector has outperformed.
2. Second, it excludes financial firms (as defined by the FTSE-ICB classifications) from the index, and that sector has underperformed during the recent selloff.
As a result, the sector weightings and stock selection in the QQQ is sometimes significantly different than the broader U.S. market.
Sector weightings and stock selection drive wedge between returns
Sector and stock returns have suddenly become very different. The difference between the best and worst performing stock in the S&P 500 is 130% as of April 22, 2020 (REGN +48.6% vs NCLH -81.4% year to date).
For this analysis we use the S&P 500 and its GICS sectors as our benchmark. Chart 2 shows that the Nasdaq-100 portfolio has very different sector construction. The Nasdaq-100 index is:
- Overweight in information technology, communications services and consumer discretionary sectors.
- Has a healthy allocation to healthcare and consumer staples also.
- By design, it excludes ICB financials, but it also has no energy or materials exposures at the moment.
Chart 2: Nasdaq-100 vs. S&P 500 Sector Weights; S&P 500 Performance
The balls in Chart 2 also show the sector returns (right axis). In many cases the underweight sectors have performed the worst, while the overweight sectors have performed the best.
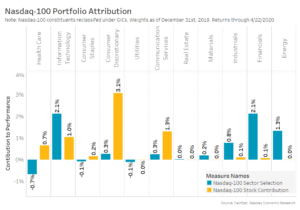
Interestingly, when we decompose the 12.6% of outperformance we find that sector selection accounts attribution for just under half. Although as Chart 3 shows, the majority of sector selection outperformance comes from weightings in Tech (overweight accounts for outperformance of 2.1%). Conversely, the absence of exposure to Financials (down -30.1%) and Energy (down -43.9%) has added outperformance of 3.4%.
However over half of the outperformance comes from stock selection. That shows how the market is currently rewarding “new economy” stocks as we all work from home. Surprisingly, half of the stock selection alpha comes from the consumer discretionary sector. That’s thanks to QQQ’s large holdings in AMZN, TSLA, JD, among others. Other stock selection comes in Info Tech (MSFT, NVDA, AAPL and more) and Communications (FB, GOOG, NFLX) sectors.
Chart 3: Nasdaq-100 performance attribution shows sector and stock selection add around 6% each
This highlights what the market thinks of COVID-19
Past performance is no guarantee of future performance, but that’s not today’s point.
This attribution highlights and explains the where the outperformance of the QQQ has come from during a very unusual market. It provides insight into what market professionals are thinking. That’s what markets do.
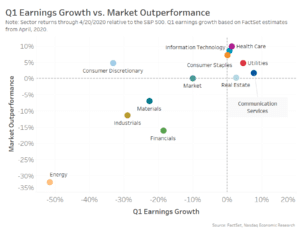
In fact, we see (from the diagonal nature of the data in Chart 4) that Q1 earnings growth is very aligned with the sector performance so far this year.
- Healthcare and Consumer Staples are outperforming as consumers cook at home and COVID-19, tragically, increases medical expenses.
- Energy, which this week saw May WTI futures contract expire with a negative value, is the worst performer. That’s thanks to the lack of demand for oil while planes, cars and factories are idled, which has in turn affected Industrials and Materials.
- While the performance of Financials seems to reflect the fear that government rescues will not prevent a number of personal and corporate defaults.
Chart 4: Industries most affected by COVID-19 year-to-date
Arguably, since the approval of the $2 trillion rescue package, stocks have rallied 13%. In fact, we’re currently down 17% from the market highs earlier this year, not as steep a market decline as one might expect given these grave circumstances. That’s much better than the average recession drawdown of 44%. That implies a positive cost-benefit from government funds from a shorter recession than usual, likely with a strong recovery.
Let’s hope the market is right.
The views represented in this commentary are those of its author and do not reflect the opinion of Traders Magazine, Markets Media Group or its staff. Traders Magazine welcomes reader feedback on this column and on all issues relevant to the institutional trading community.


