


By David Russell, Global Head of Market Strategy, TradeStation
When it comes to stock picking, traders often identify potentially attractive stocks and go all in only to become frustrated when their positions get hit by a selloff in the broader market. They may even get stopped out and ultimately miss the rally they initially expected. In trading, there are fewer more disappointing events than when a trader buys individual stocks at the wrong time. But this risk can be managed if traders take the time to understand an underappreciated market phenomenon — the market’s volatility cycle.
We can look back as far as 20 years or more and clearly see that the markets move in a cyclical pattern, and each phase of the cycle reflects the types of trades that may be advantageous. While this may be a historic cycle, past performance is never guaranteed. Ultimately, traders who recognize this volatility cycle can potentially use it to their advantage.
What is the cycle of volatility?
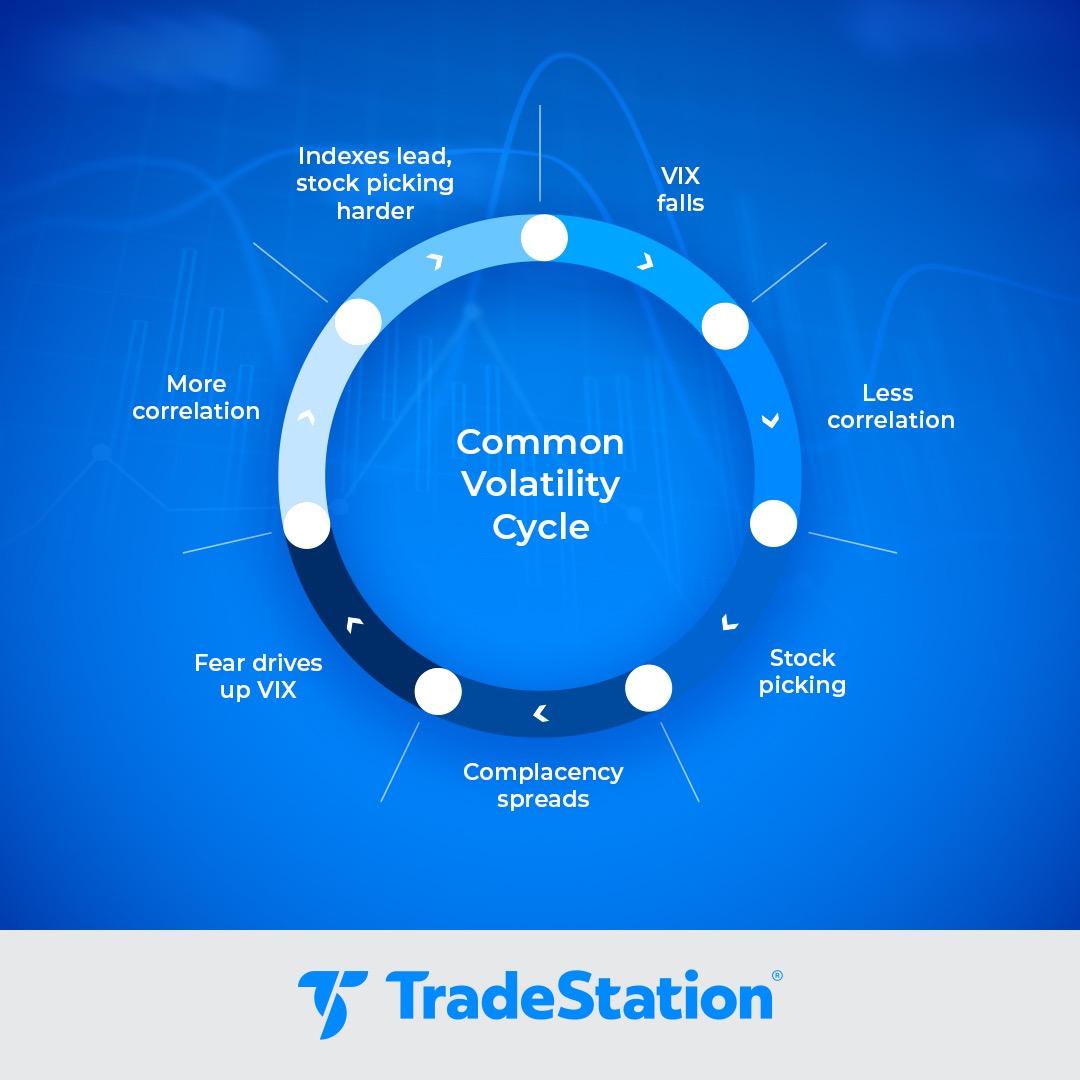
Just as the weather moves in a seasonal pattern, the markets also go through a series of correlated and uncorrelated moves, as well as the rise and fall of The Chicago Board of Options Exchange’s (CBOE) Volatility Index (VIX). The VIX is based on the implied volatility of S&P 500 Index options. When the market crashes, for example, this indicates a phase of correlated volatility where most stocks go down together — and it closely follows fear driving up the VIX. After the initial crash, most stocks then rebound together. In both of these instances of correlated volatility, indexes lead and stock picking becomes less fruitful because there is more correlation between stocks.
As gains slow and volatility fades, which the VIX indicates, correlation diminishes and the market enters a phase of uncorrelated calm. Here, the indexes give less opportunity, but individual stocks start moving on their own merit. In such cases, traders could be in a better position to maximize returns by selecting stocks of the individual companies that are showing strength.
As we move through this phase of uncorrelated calm, complacency can take hold setting the stage for the next crash – where the cycle then repeats. As the market gets complacent, the use of margin increases as investors get comfortable taking more risk. This period gradually morphs into the aforementioned complacency. The use of leverage during the calm works in the opposite direction, causing volatility as leverage unwinds. This forced selling often causes the resulting correlated crash. It’s important to note that increased correlation causes indexes to lead over stock picking.
When thinking about the cycle of volatility, we can draw an analogy to the weather. It’s largely understood that winter takes place between December and March, and summer takes place between June and September. People prepare accordingly based on their understanding of the weather during these seasons. Just as it’s important to understand the weather to avoid getting caught off guard, it’s also important to understand the market’s cycle of volatility for the same reason.
In summary, there are correlated index-based crashes and correlated index-based rebounds where a strategy of trading the major indexes makes the most sense. Following, there is a period of uncorrelated calm where stock picking becomes easier and more favorable because individual movement is easier to spot.
Viewing the market in this cycle can potentially help traders better determine their strategy. This framework also gives traders a paradigm to approach bigger-picture movements, instead of being swayed by emotions and taking actions that may not be in their best interest.
Understanding the historical cycle
Cycles of correlated volatility and uncorrelated calm have repeated themselves throughout history, which suggests that a “set it and forget it” approach to trading isn’t enough. Let’s look at a more recent example.
The results of the Federal Open Market Committee meetings that took place between September and November of 2023 contributed to heightened market volatility, and as a result, enhanced correlation. This is because the Federal Reserve left rates unchanged — possibly signaling a return to more dovish conditions — while reserving the right to increase rates if necessary.
The sudden fear about monetary policy set off a period of volatility, which included an initial rebound between late October and early November. The release of third-quarter productivity data — particularly nonfarm business sector labor productivity increasing 5.2%, the highest rate since the third quarter of 2020 — signaled lower interest rates and a period of uncorrelated calm. This again prompted a need to shift investment strategies.
The role of technology in the cycle of volatility
There is an array of trading tools that can help traders navigate the shifting market cycle and seamlessly switch between index and futures trading during periods of more correlation to stock picking during periods of less correlation — and back again. In addition, these platforms can offer detailed contextual information, including crucial VIX information, to help ensure traders are informed of the forces driving market movements to potentially avoid making uninformed or rash decisions.
The cycle of volatility sets the stage for sophisticated traders to gain a broader understanding of cyclical market movements rather than getting distracted by the day-to-day minutiae. Developing a paradigm that looks at these bigger-picture market manifestations can help traders act quickly and efficiently — especially since this cycle typically repeats over time.
FLASH FRIDAY is a weekly content series looking at the past, present and future of capital markets trading and technology. FLASH FRIDAY is sponsored by Instinet, a Nomura company.


