


TECH TUESDAY is a weekly content series covering all aspects of capital markets technology. TECH TUESDAY is produced in collaboration with Nasdaq.
I have an inquisitive 10-year-old son, and I want to foster his curious nature. As such, we embrace the mantra: “there are no bad questions.” That said, he doesn’t like my answers to “why can’t we get a Cybertruck?”

I try to cultivate a similar mentality when I’m part of educational events. Last week, I participated in Nasdaq’s regular cadence of webinars with Interactive Brokers.
As we wrapped a presentation that addressed the qualities that made and make the Nasdaq-100® Index (NDX) unique, there was a fabulous question that continues to grind in my mind. I’ll paraphrase the inquiry:
“Given the maturation of the mega-cap technology and consumer discretionary sectors, could you explain a scenario where NDX volatility (realized or implied) traded at a discount to S&P 500 Index (SPX) volatility?”
My response in the moment was sufficient, but this medium affords me greater flexibility to flush out the thinking.
Background
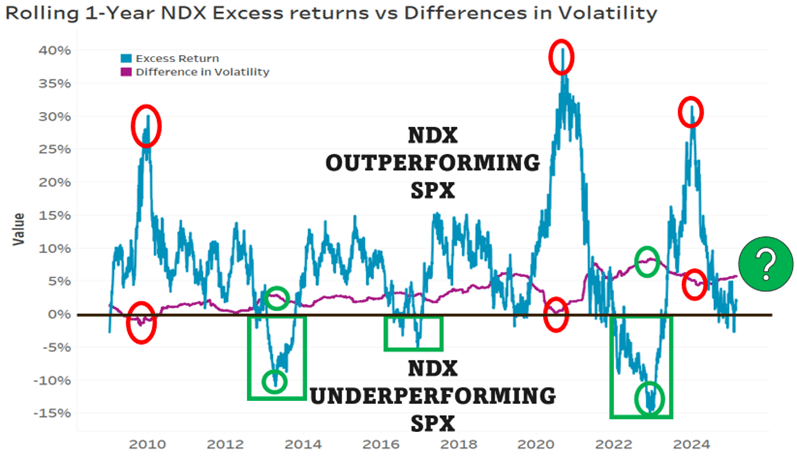
Historically, periods where NDX realized volatility is below that of the SPX are few and far between. The visual below is busy, but useful. The data starts January 1, 2008, and runs through mid-February 2025. Let’s understand what it shows.
Source: Nasdaq Economic Research
- Blue line: Plots “Rolling 1-Year Price Returns” for the NDX minus the “Rolling 1-Year Price Returns” for the SPX.
- Takeaway: Since the financial crisis, the NDX has consistently outperformed relative to the SPX. There have been ~3 periods of underperformance. Notably: 2013, mid-2016 and much of 2022 – highlighted in green.
- Purple line: Plots the “Rolling 1-Year Realized Volatility” measure for the NDX minus the “Rolling 1-Year Realized Volatility” for the SPX.
- Takeaway: Generally, the NDX realizes +3.1 higher volatility when compared to the SPX. The volatility spread narrowed considerably following the most acute crises of the past two decades, specifically after the GFC and during the COVID recovery – highlighted in red. Those vol convergences coincided with two of the most significant periods of NDX outperformance.
The bigger question becomes, why might that realized volatility spread narrow or expand?
Data:
- 2008 – Present average NDX annualized volatility: 21.4%
- 2008 – Present average SPX annualized volatility: 18.3%
On average NDX moves with a 3.15 vol premium to SPX realized volatility.
- 2024 – NDV average annualized volatility: 17.0%
- 2024 – SPX average annualized volatility: 12.1%
Last year, the spread widened to an average width of NDX +4.9 vols.
The widest the rolling volatility spread date was December 2, 2022, and the period between late 2022 and early 2023 dominates the list widest spreads. That coincided with a meaningful bottom for the NDX and catalyzed a period of very significant outperformance. Mega-cap technology names suffered some of the largest drawdowns during the inflationary environment of 2022.
The list of dates where the vol spread inverted (NDX trailing vol < SPX trailing vol) is clustered around October and November 2009. Keep in mind that one year prior was the period of the most acute volatility during the financial crisis. While every sector was impacted during the 2007 – early 2009 selloff, the losses centered on and around the financial services area.
In fact, the list of largest bankruptcies in United States history are dominated by financials. Seven of the top 12 insolvencies were financial firms. Market history students likely know the two largest – Lehman Brothers (9/15/2008) and Washington Mutual (9/26/2008). Perhaps it’s no surprise that a year later, the trailing volatility for the NDX would be below the SPX.
In fact, the only full year (in window analyzed) where the NDX moved with a lower volatility than the SPX was 2009 (NDX vol = 26.46%; SPX vol = 27.27%).
Takeaway: As macro volatility (systematic risk) declines, the spread between NDX and SPX realized volatility tends to widen. When systematic risk increases (crises), the spread typically narrows. Over the past two decades, systemic risks have centered around financial firms. Periods of wider vol spread typically accompany NDX underperformance.
More Recently
Looking at NDX rolling excess returns (blue line above), the very meaningful outperformance during calendar year 2023 shifted on 12/29/2023.
- NDX Total Return (2023): +53.8%
- SPX Total Return (2023): +26.8%
That relationship has narrowed for the past 13 months. In late January 2025, it moved slightly negative, meaning 1-year trailing NDX returns were less than those of the SPX. The brief narrative there is one of mega-cap tech underperformance (short-term) and outperformance on the part of financials. We’ve been in a (historically) low correlation (high dispersion) market with some significant sector rotation.
Are we approaching an inflection point whereby the NDX begins outpacing again? Time will tell, but the continued growth in Nasdaq-100 (NDX) (and Nasdaq-100 Micro (XND)) Index Options may be indicative of sophisticated clients expressing their longer-term views on the relationship. Average daily volumes in the NDX hit a multi decade high in January 2025.
Large-Cap Equity Indexes are Not the Same
In many ways, volatility is the nuclear driver across capital markets. It’s at the core of every institutional and individual portfolio whether their beneficial owners know it or not. Change IS the constant. We invest because we expect things to change and over long horizons, that change tends to be for the better. It’s beneficial to asset owners.
The linchpin behind index option prices/values is volatility. Specifically, how volatile is the reference asset likely to be for the life of the option? It’s an estimate that changes dynamically. Index options can be used to define risk over a discrete time frame. They can be used express a forward-looking view. Index options can be incorporated to potentially enhance portfolio yield or manage cash flows. They are profoundly flexible tools.
At the index level, volatility is driven by the constituents (and their pairwise correlation). There are very real differences between the NDX and SPX. The NDX includes the 100 largest Nasdaq-listed companies, excluding financials. The median SPX sector exposure to financials since 2000 is 13%. The NDX includes no financials. For a full breakdown of NDX methodology: https://indexes.nasdaq.com/docs/Methodology_NDX.pdf
Keep asking questions and stay current on your Davitt Data for more analysis.
Bonus Visuals:
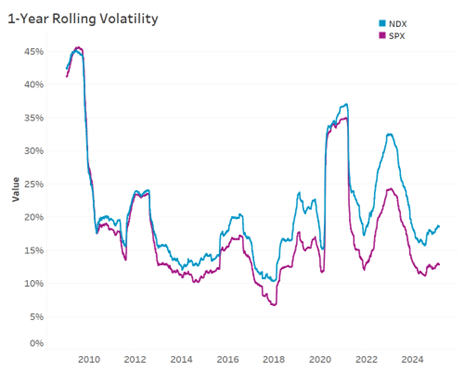
Source: Nasdaq Economic Research
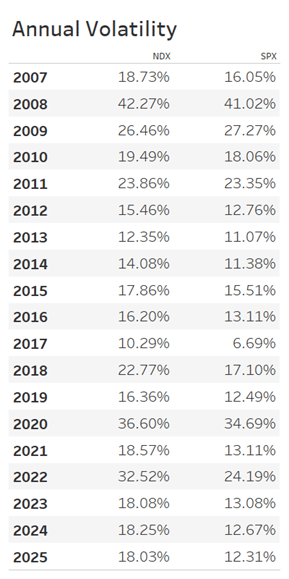
Source: Nasdaq Economic Research
Creating tomorrow’s markets today. Find out more about Nasdaq’s offerings to drive your business forward here.


